CSU East Bay logo

Chemistry 352

The Birge-Sponer Method

The Birge–Sponer extrapolation is a graphical method used to estimate the dissociation energy of a diatomic molecule from vibrational spectroscopy data. It exploits the systematic decrease in vibrational level spacing caused by anharmonicity.

The key idea is that vibrational level spacings, \(\Delta G_{v+1/2}\), decrease smoothly as the vibrational quantum number increases and eventually approach zero at dissociation.


Step 1: Use measured vibrational spacings

From a spectrum (typically UV-visible, but could also be infrared), one can determine the spacings between successive vibrational levels within a single electronic state of a molecule:

\[ \Delta G_{v+1/2} = G_{v+1} - G_v. \]

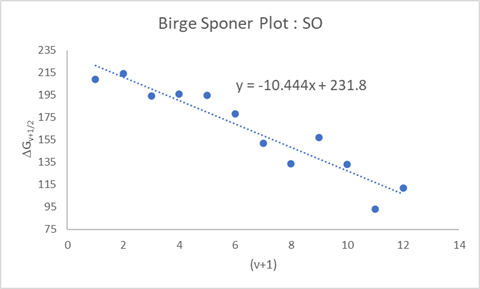
For an anharmonic oscillator, these spacings are well approximated by

\[ \Delta G_{v+1/2} = \omega_e - 2\omega_e x_e (v+1). \]

This expression predicts a linear decrease of \(\Delta G_{v+1/2}\) with increasing \((v+1)\).


Step 2: Birge–Sponer plot

In the Birge–Sponer method, the measured spacings \(\Delta G_{v+1/2}\) are plotted against \((v+1)\).

From a linear fit to the data, both \(\omega_e\) and \(\omega_e x_e\) can be extracted directly.


Step 3: Determining the highest bound level

Dissociation occurs when the spacing between vibrational levels goes to zero:

\[ \Delta G_{v+1/2} = 0. \]

Extrapolating the fitted line to zero spacing yields the maximum vibrational quantum number, \(v_{\max}\), corresponding to the highest bound vibrational level.


Step 4: Determining the dissociation energy \(D_0\)

The dissociation energy from the lowest vibrational level, \(D_0\), is obtained by summing (or integrating) all vibrational spacings up to dissociation:

\[ D_0 = \sum_{v=0}^{v_{\max}} \Delta G_{v+1/2}. \]

Graphically, this corresponds to the area under the Birge–Sponer plot from \((v+1)=0\) to \((v+1)=v_{\max}+1\).

In practice, the area is evaluated using the fitted straight line, providing an estimate of \(D_0\) in spectroscopic units (\(\text{cm}^{-1}\)).


Big idea: the Birge–Sponer extrapolation uses anharmonic vibrational spacings to estimate molecular dissociation energies by extrapolating to the point where vibrational binding disappears.

Worked example: Birge–Sponer extrapolation for SO (upper electronic state)

The data below are band positions for an electronic absorption progression in SO. The lower electronic state is fixed (typically \(v''=0\)), while the upper-state vibrational quantum number \(v'\) changes.

If the absorption band positions are \(\tilde{\nu}(v')\), then successive differences remove the electronic origin and the (constant) lower-state term values:

\[ \Delta G_{v'+1/2} \equiv G_{v'+1}-G_{v'} = \tilde{\nu}(v'+1)-\tilde{\nu}(v'). \]


Step 1: Compute the vibrational spacings \(\Delta G_{v'+1/2}\)

\(v'\) \(\tilde{\nu}(v')\) (cm−1) \(\Delta G_{v'+1/2}=\tilde{\nu}(v'+1)-\tilde{\nu}(v')\) (cm−1)
050412209
150621214
250835194
351029196
451225195
551420178
651598152
751750134
851884157
952041133
105217493
1152267112

Step 2: Fit \(\Delta G_{v'+1/2}\) vs \((v'+1)\)

For an anharmonic oscillator,

\[ \Delta G_{v'+1/2}=\omega_e-2\omega_e x_e\,(v'+1), \]

which is linear in \((v'+1)\). A best-fit line to the data gives:

\[ \Delta G_{v'+1/2} \approx 231.80 cm^{-1} - 10.44 cm^{-1} \,(v'+1) \qquad (\text{cm}^{-1}). \]

Therefore,

Birge-Sponer plot for SO

Step 3: Extrapolate to find \(v'_{\max}\)

Dissociation corresponds to spacings going to zero: \(\Delta G_{v'+1/2}=0\). Using the fitted line,

\[ 0=231.80-10.44\,(v'+1) \quad\Rightarrow\quad (v'+1)\approx 22.19 \quad\Rightarrow\quad v'_{\max}\approx 21.19. \]

This means the upper electronic state supports roughly \(v'=0\) through \(v'\approx 21\) bound vibrational levels (the last one is near dissociation).


Step 4: Area under the Birge–Sponer plot gives \(D_0\)

The dissociation energy from the bottom of the upper-state potential, \(D_0\), is the sum (area) of the vibrational spacings up to dissociation:

\[ D_0 \approx \int_{0}^{(v'_{\max}+1)} \Delta G_{v'+1/2}\,d(v'+1). \]

Since the fitted line is a straight line that goes to zero at \((v'+1)\approx 22.19\), the area is a triangle:

\[ D_0 \approx \frac{1}{2}\,(\text{base})(\text{height}) =\frac{1}{2}(22.19)(231.80) \approx 2.57\times 10^3\ \text{cm}^{-1}. \]

Result: the dissociation energy of the upper electronic state (from \(v'=0\)) is approximately \(D_0 \approx 2.57\times 10^3\ \text{cm}^{-1}\).

Big picture: by converting a vibrational progression into level spacings and extrapolating those spacings to zero, the Birge–Sponer method turns a spectrum into a quantitative estimate of the dissociation energy.

Your turn

Problem 1
In a Birge–Sponer analysis, what quantity is plotted on the vertical axis?
\(G_v\)
\(\Delta G_{v+1/2}\)
\(\omega_e\)
\(v+1\)
Problem 2
What physical quantity is represented by the area under a Birge–Sponer plot?
The harmonic vibrational frequency \(\omega_e\)
The anharmonicity constant \(\omega_e x_e\)
The dissociation energy \(D_0\)
The zero-point energy
Problem 3
In the linear fit \(\Delta G_{v+1/2}=\omega_e-2\omega_e x_e(v+1)\), what information is obtained from the slope?
\(2\omega_e x_e\) (and therefore anharmonicity)
The dissociation energy \(D_0\)
The zero-point energy
The reduced mass
Problem 4
Why does the Birge–Sponer extrapolation require anharmonic vibrational behavior?
Harmonic oscillators do not absorb IR radiation
Harmonic oscillators have too many vibrational levels
Harmonic oscillators give incorrect wavefunctions
Only anharmonic potentials show decreasing level spacings that go to zero at dissociation

Key points (one glance)

Big picture: the Birge–Sponer extrapolation uses anharmonic vibrational level spacings to connect infrared spectra directly to molecular dissociation energies.